How to shift budget from “more traffic” to “better conversion” (2025 report)
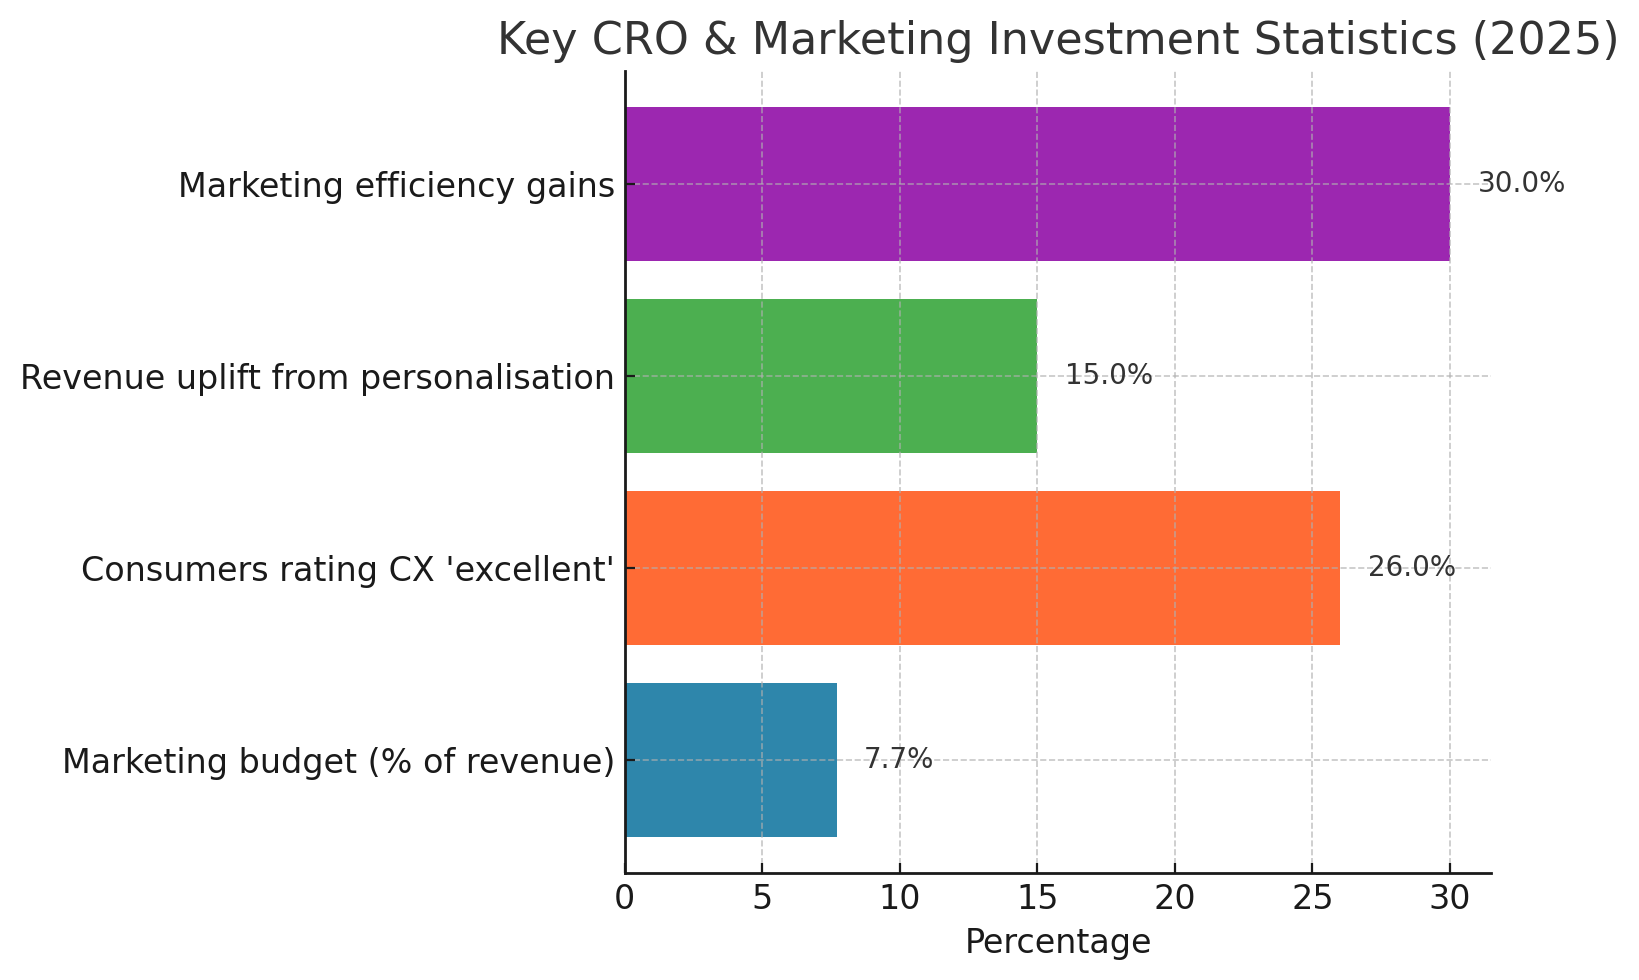
Marketers have never had more pressure to do more with less. Average marketing budgets sit at 7.7% of company revenue for the second year running, according to Gartner’s 2025 CMO Spend Survey. That’s flat year-on-year and well below pre-pandemic norms—so every pound has to work harder. campaignlive.com
At the same time, consumer expectations keep rising. Adobe’s latest Digital Trends study shows only 26% of consumers rate the digital experience from brands they already buy from as “excellent”, and 80% expect seamless experiences across channels—clear signals that improving the on-site journey (not just pumping more media) is where the headroom lies. business.adobe.com
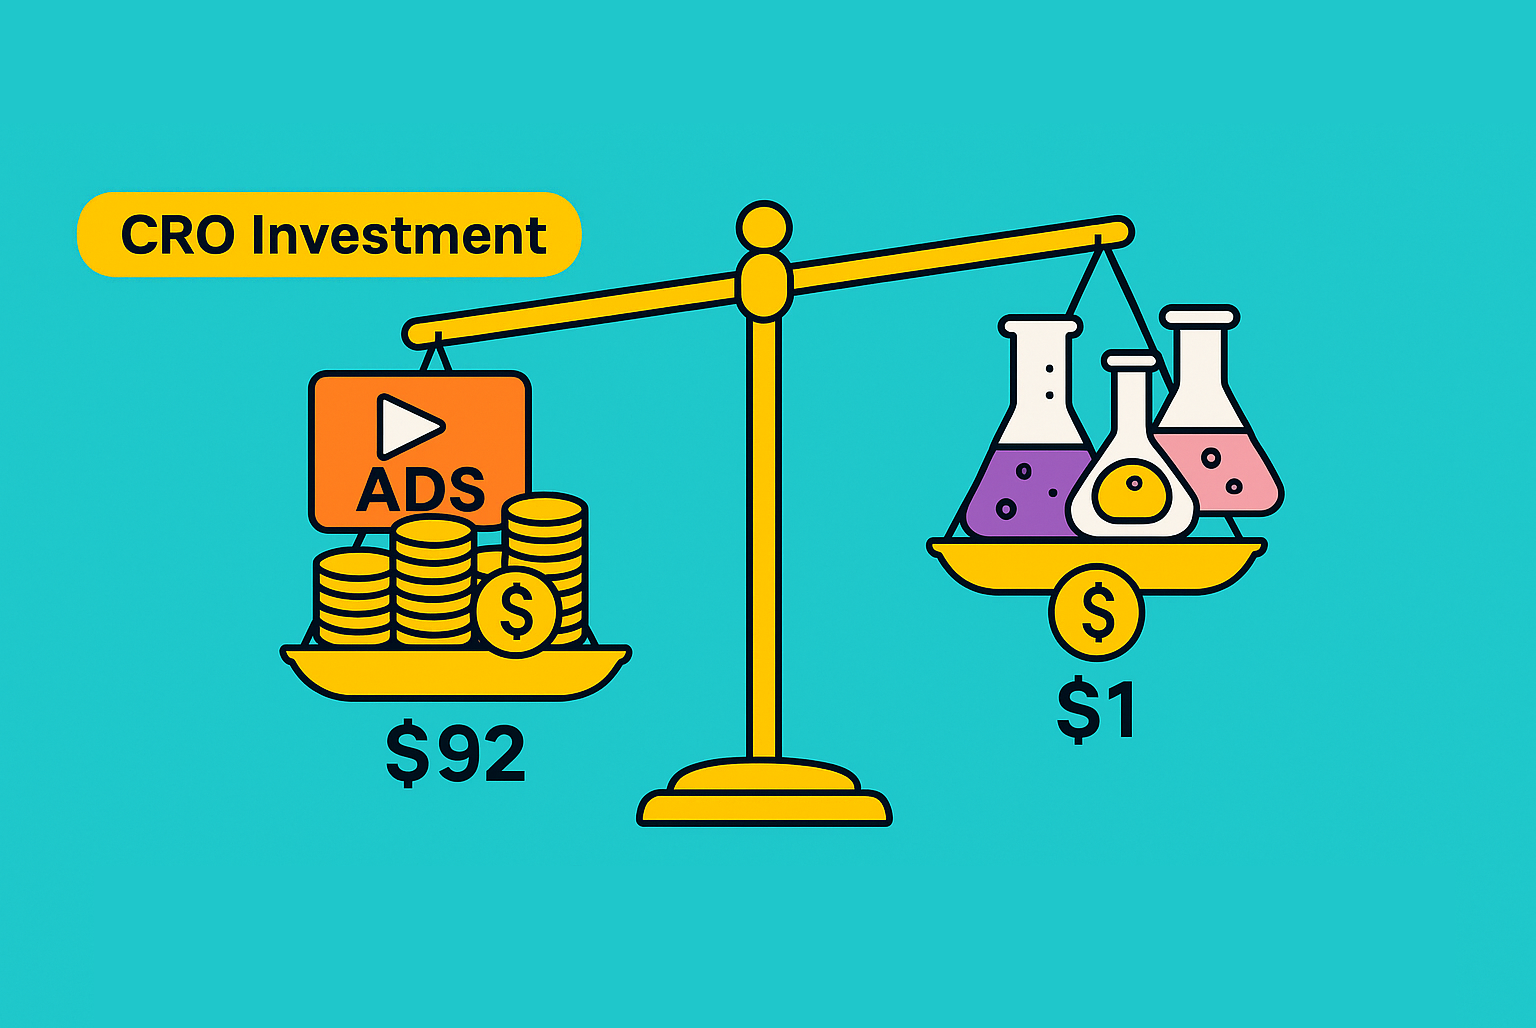
The problem with the classic “$92 vs $1” stat
You’ve likely seen the line: “for every $92 spent on acquisition, only $1 is spent on conversion.” It’s widely attributed to older eConsultancy research and gets echoed across blogs. Treat it as a historical signal, not a current benchmark—the original study is outdated and difficult to source directly today. Still, the pattern it points to remains visible: budgets skew to acquisition while optimisation is under-resourced. (Use the more current datapoints below to make your case and footnote the $92:$1 claim as a historical reference only.) Econsultancy
Where budgets are actually moving in 2025-26
-
Budgets are tight, reallocations matter. Gartner finds average budgets at 7.7% of revenue; half of CMOs report 6% or less. Translation: optimisation wins will likely be funded by reprioritisation, not net-new money. campaignlive.com
-
UK view: The IPA’s Bellwether data shows budgets dipped in Q1 2025 amid macro uncertainty, with a rebound in Q2—evidence of volatility that favours lower-waste, higher-efficiency initiatives like CRO. Financial Times
-
CX and data investment still rising. Forrester’s Planning Guides highlight continued prioritisation of CX, measurement, and experimentation/AI—areas tightly coupled with CRO programmes. Forrester
Why CRO/experimentation is getting the nod
-
Consumers want better journeys, not more ads. Only 26% rate current experiences “excellent”; 80% want channel-consistent journeys; 91% say responsible data use is “important” or “critical”. These are conversion levers, not media levers. business.adobe.com
-
Personalisation & experimentation lift revenue and efficiency. McKinsey’s research shows personalisation typically drives 5–15% revenue uplift and 10–30% marketing-spend efficiency gains—uplift you unlock via testing, UX and CRO. McKinsey & Company
-
Tooling momentum post-Google Optimize. With Optimize sunset in 2023, teams either upped their experimentation maturity or exited. (Google’s own help docs confirm the sunset.) This has nudged serious brands to professionalise programmes and tooling. Google Help
What “investment in CRO” looks like (beyond a line item)
People & process. High-performing programmes treat experimentation as an operating system. HBR has hammered this for years: you need culture, cadence and acceptance that many tests won’t “win” (roughly 1 in 10 do). The payoff is organisational learning that compounds. Harvard Business School
Platforms & measurement. Post-Optimize, enterprise tools have doubled down on experiment velocity, win rate and ROI reporting to help teams secure budget. (Optimizely’s reporting docs are a good illustration of what senior stakeholders expect to see.) Optimizely World
UX & checkout fundamentals (especially for e-commerce). Baymard’s long-running research pegs average cart abandonment around ~70%, and their cohort/quant studies show checkout fixes move the needle. If you sell online, this is the first CRO dividend to harvest. Baymard
Benchmarks & signals you can quote (neutral sources)
-
Marketing budget context (board-level). Marketing averages 7.7% of revenue in 2025 (Gartner, via Campaign). Use this to frame why re-allocating toward CRO is prudent. campaignlive.com
-
Experience gap (customer-level). Only 26% of consumers rate brand digital CX “excellent”; 80% expect cross-channel consistency (Adobe Digital Trends 2024). This is your CRO brief, in a sentence. business.adobe.com
-
Personalisation payoff (exec-level). 5–15% revenue lift and 10–30% spend-efficiency gains from personalisation done right (McKinsey). Position experimentation as the engine that finds which personalisation actually works. McKinsey & Company
-
Checkout reality (trader-level). ~70% cart abandonment (Baymard). That’s pure leakage; CRO funds itself by reducing it. Baymard Institute
Tip: If you’re pressed on “how much should we invest?”, a pragmatic starting point is to carve out 10–20% of digital budget into a test-and-learn envelope (people + tools + incentives), then grow funding with proven ROI. Back it with a monthly “programme ROI” report (velocity, win rate, incremental revenue) as per enterprise reporting templates. Optimizely World
A simple, defensible model for the CFO
-
Frame the headroom. Use Adobe (experience gap) + Baymard (leakage) to size the opportunity on your own funnel. business.adobe.com
-
Commit to cadence. Aim for a target experiment velocity (e.g., N meaningful tests/month per key journey). HBR’s guidance: normalise that most tests won’t win—the portfolio does. Harvard Business School
-
Link to money. Attribute incremental revenue from winning tests and report quarterly alongside media efficiency—mirroring vendor reporting frameworks used to unlock more budget. Optimizely World
Your 90-Day CRO Roadmap: Practical & Evidence-Based
Many marketing leaders hesitate to invest in CRO because they see it as a long-term play with uncertain payback. In reality, meaningful progress can be made in just three months. The key is to focus on the highest-impact friction points, prove value quickly, and build momentum with a structured test-and-learn approach. Here’s a practical, evidence-based 90-day roadmap designed to help leaders demonstrate results fast and unlock further investment.
-
Weeks 1–2: Baseline & prioritise
-
Build a friction map of the top journey(s). Triangulate quant (analytics, drop-offs) with qual (session replays, voice-of-customer).
-
Pull Baymard’s checkout heuristics if you’re e-com; they’re battle-tested patterns. Amazon Media
-
-
Weeks 3–8: Ship high-probability fixes
-
Reduce form/checkout friction, clarify pricing & delivery, streamline payment options. (Baymard shows payment-option gaps drive measurable abandonment.) Amazon Pay – US
-
Run at least 1x value-prop test and 1x navigation/information-scent test per key page.
-
-
Weeks 9–13: Personalise & scale
-
Introduce one targeted personalisation (e.g., intent-based content) and test it. Use McKinsey’s ranges to set realistic uplift expectations with leadership. McKinsey & Company
-
Stand up an exec-friendly programme dashboard (velocity, win rate, incremental revenue, CAC/ROAS delta). Optimizely World
-
Source transparency
-
Gartner CMO Spend (2025): budgets at 7.7% of revenue (coverage via Campaign). Useful for board-level framing. campaignlive.com
-
Adobe Digital Trends 2024 (PDF): consumer & exec surveys; quantified expectation/experience gaps and AI adoption posture. (We reviewed and cited the primary PDF.) business.adobe.com
-
McKinsey (Personalisation): conservative, peer-reviewed style ranges on revenue and efficiency impact. McKinsey & Company
-
Baymard Institute: long-running checkout UX research; cart abandonment benchmark and quantified reasons. Baymard Institute
-
IPA Bellwether / FT coverage (UK): budget sentiment and volatility (useful local context for your clients). Financial Times
-
Experimentation operating model (HBR/HBS): culture & cadence evidence to set expectations with leadership. Harvard Business School
Start optimising your website
Get actionable insights to grow conversions and revenue.
Get your free 45min performance review